Written by Adeel Abbas
An adsorption isotherm is a graphical representation of the relationship between the concentration of the adsorbate (the variable x) and the amount of adsorbate that is adsorbed onto the solid phase (the variable y).
Adsorption isotherms help determine the quantity of adsorbate that is adsorbed by the solid phase. If you want to know why you need to know about adsorption isotherms, then you have come to the right place.
Adsorption isotherms are useful in determining the amount of adsorbate that will be adsorbed onto a solid phase. In this article, we will describe the main types of adsorption isotherms and why you should care about them.
We will also provide an example of how to use adsorption isotherms to determine the maximum adsorption capacity of a solid phase and how to use this information to optimize the adsorption process.
As we have discussed in surface chemistry that the adsorption of a gas on solid surface in a closed vessel is a reversible process. There is a sort of dynamic equilibrium between the adsorbed molecules and the gaseous molecules free in the vessel.
This concept can help is to say that the amount of gas adsorbed depends upon pressure and temperature at equilibrium stage.
What is adsorption isotherm?
Table of Contents
The world isotherm means same temperature. By keeping temperature constant we can study the change of adsorption of gas by change of pressure.
Hence the relationship between equilibrium pressure of a gas and the weight of the gas adsorbed on the solid surface is called adsorption isotherm.
Adsorption isotherms are given in the form of an equation which can be further depicted in the form of a graph. This graph is mostly a curve.
Types of adsorption isotherms
Different scientists have proposed different adsorption isotherms. Two of such isotherms are discussed as follows.
1: Freundlich adsorption isotherm
Freundlich adsorption isotherm has been proposed by the concerned scientists in the shape of an empirical relationship which is as follows.
w/m = kP1/n
in the above equation
w stands for Mass of the gas adsorbed on the surface of liquid.
M stands for mass of the adsorbent at a pressure P.
K stands for constant depending upon the nature of the gas and the absorbent. It also depends upon the temperature.
n stands for constant depending upon the nature of the gas pressure and temperature.
Graphical representation of Freundlich adsorption isotherm
If we plot a graph between pressure on x-axis and w/m on y-axis, then a rising curve is obtained as shown below.
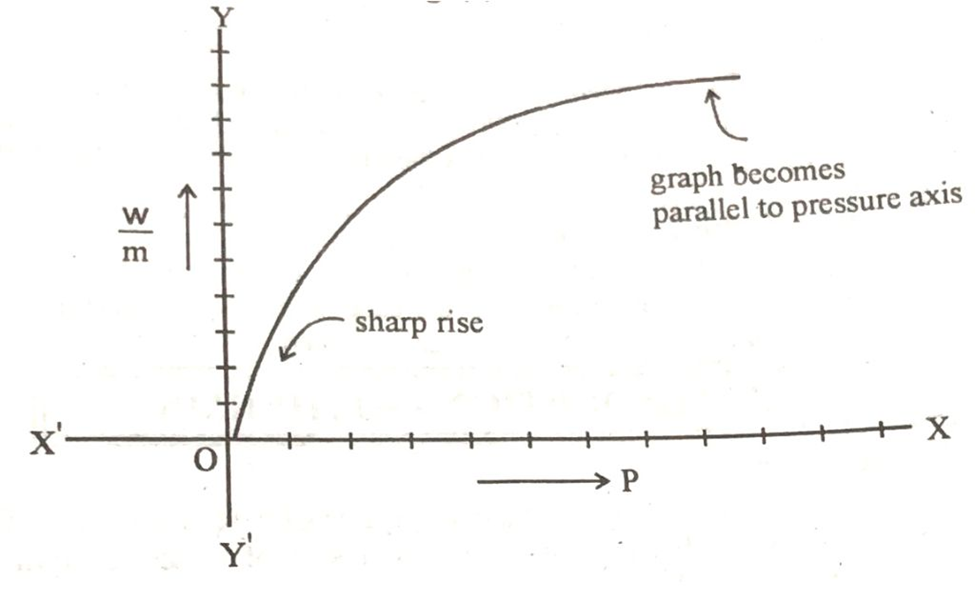
According to the shape of the graph there is a sharp rise of the curve at low pressure and ultimately it becomes parallel to the pressure axes. It means that when the pressure exceeds the certain limit, then w/m becomes constant which means that th further adsorption of the gas stops.
This equation can be converted into the equation of a straight line by taking the log on both sides. Let us take common log with base 10.
w/m = kP1/n
log w/m = kP1/n
or we can also write it as
log w/m = log k+1/n.logP
or log w/m=1/n logP + log K à (2)
Basically equation No# 2 is of straight line. Log w/m corresponds to y, log P correspond to x, log K corresponds to intercept and 1/n will be the slope of straight line. We plot a graph between log w/m on y-axis and log P on x-axis and a straight line is obtained.
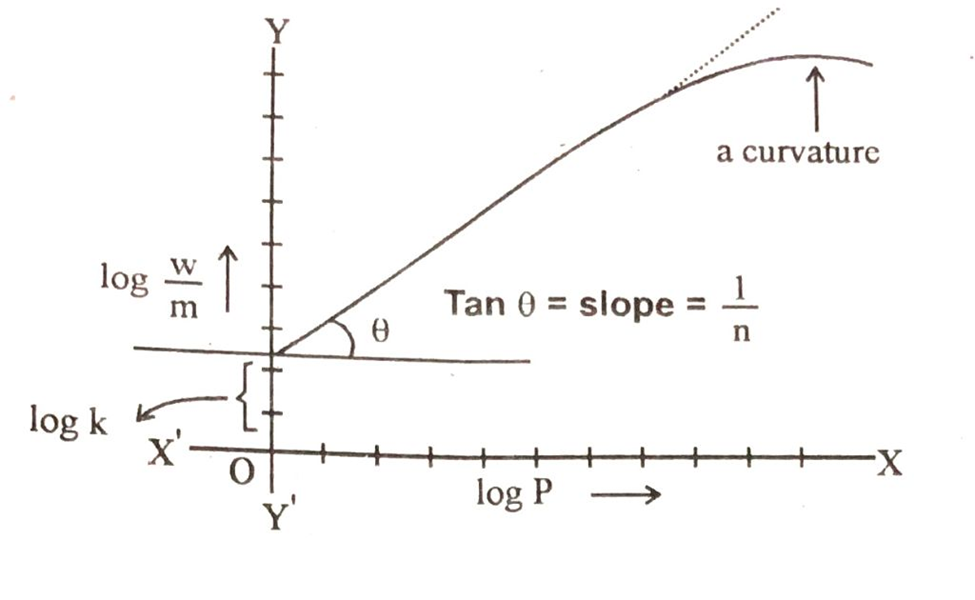
From the slope and the intercept of the straight line we can calculate the value of k and n. These two constant are the characteristics to the system under consideration.
The above graph also shows that the straight line is converted to curve at higher values of log P. It means that Freundich equation is an approximation and does not apply to the adsorption of gases by solids at high pressures.
Langmuir adsorption isotherm
The basic assumptions of Langmuir adsorption isotherm are as follows.
The gas which is adsorbed on the surface of the solid has a layer of one molecule thickness.
This unimolecular layer on the surface of the solid is uniform throughout.
There is no interaction between the molecules of the absorbed gas which are adjacent to each other.
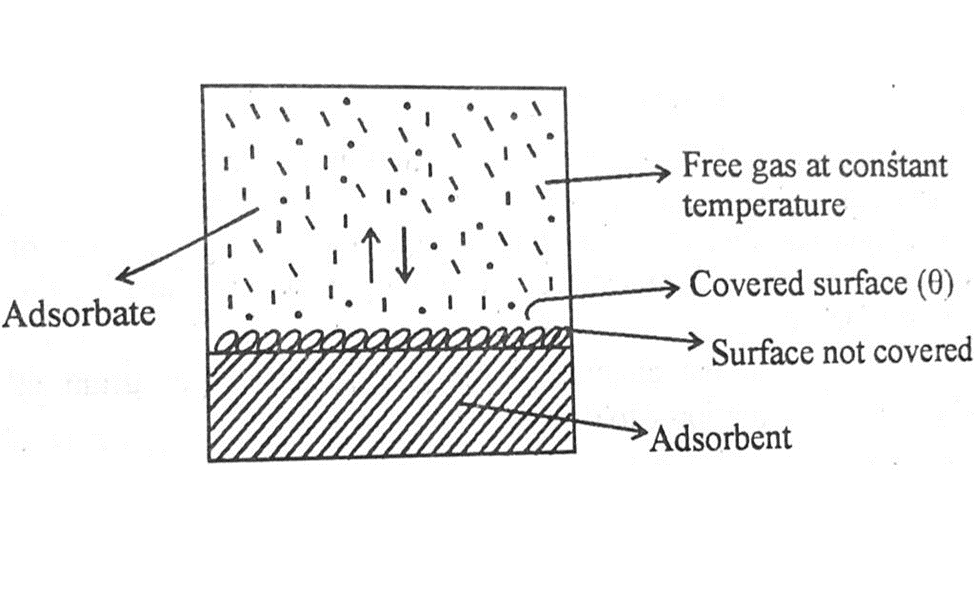
Langmuir thinks that adsorption of gas molecule is due to collisions of the gas molecules on the surface of the solid. During these collisions all the molecules are not absorbed but some of them are desorbed, or you can say they are evaporated.
At a given pressure and temperature a stage reaches when the rate of adsorption becomes equal to the rate of desorption. This is the state of dynamic equilibrium as shown in the diagram above.
Mathematical derivation of Langmuir adsorption isotherm
Suppose that the total surface of the solid which has to adsorb the gas is unity and θ is the fraction of the total surface covered by the absorbed molecules. The fraction of the naked surface is (1- θ).
Rate of desorption ∝ θ
Or Rate of desorption= Kdθ à(1)
Rate constant for the process of desorption = Kd
Rate of adsorption ∝ (1-θ) . P
Rate of adsorption = Ka(1-θ) . P à(2)
In equation (2) the rate of adsorption depends upon the bare surface and the external pressure P. Ka is the rate constant for the process of adsorption.
At this stage of dynamic equilibrium these two rates are equal so…
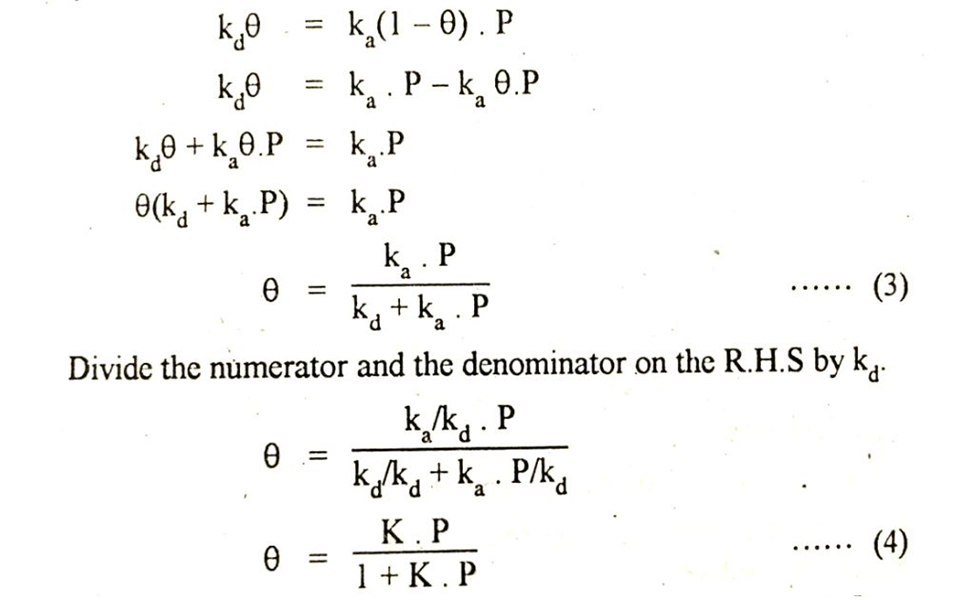
Remember that K is the ratio of two rate constants such as ka/kd.
This K is a sort of equilibrium constant for this process and it is called adsorption co-efficient. Greater the rate of adsorption on the surface of the solid, greater the adsorption co-efficient.
According to last equation in above image the fraction of the total surface covered by the gas molecules depends upon the pressure of the gas and adsorption co-efficient. Let us suppose that the amount of the gas adsorbed per gram of the absorbent is x. This is proportional to θ.
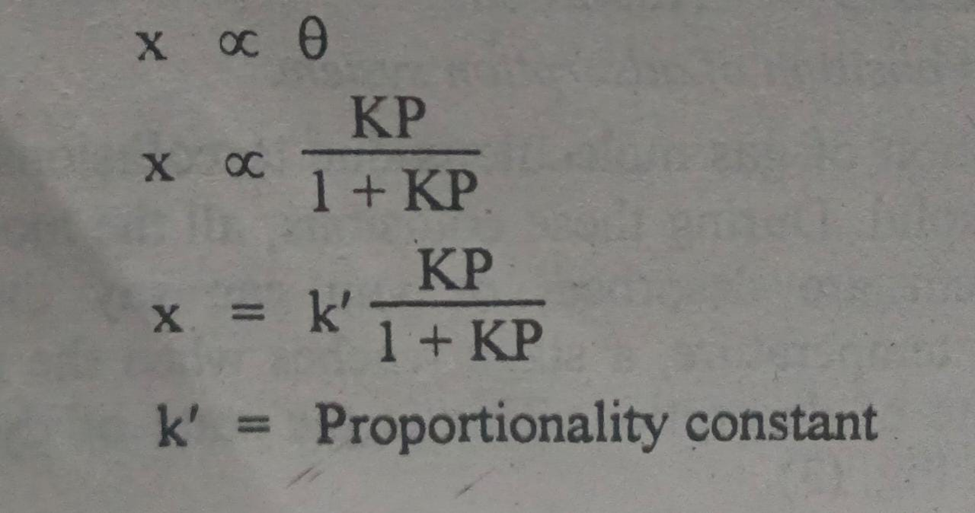
Equation in the above image gives us relationship between the amount of the gas adsorbed to the pressure of the gas at constant temperature. This equation is called Langmuir adsorption isotherm.
Let us change the shape of equation in above image to have an equation of straight line.
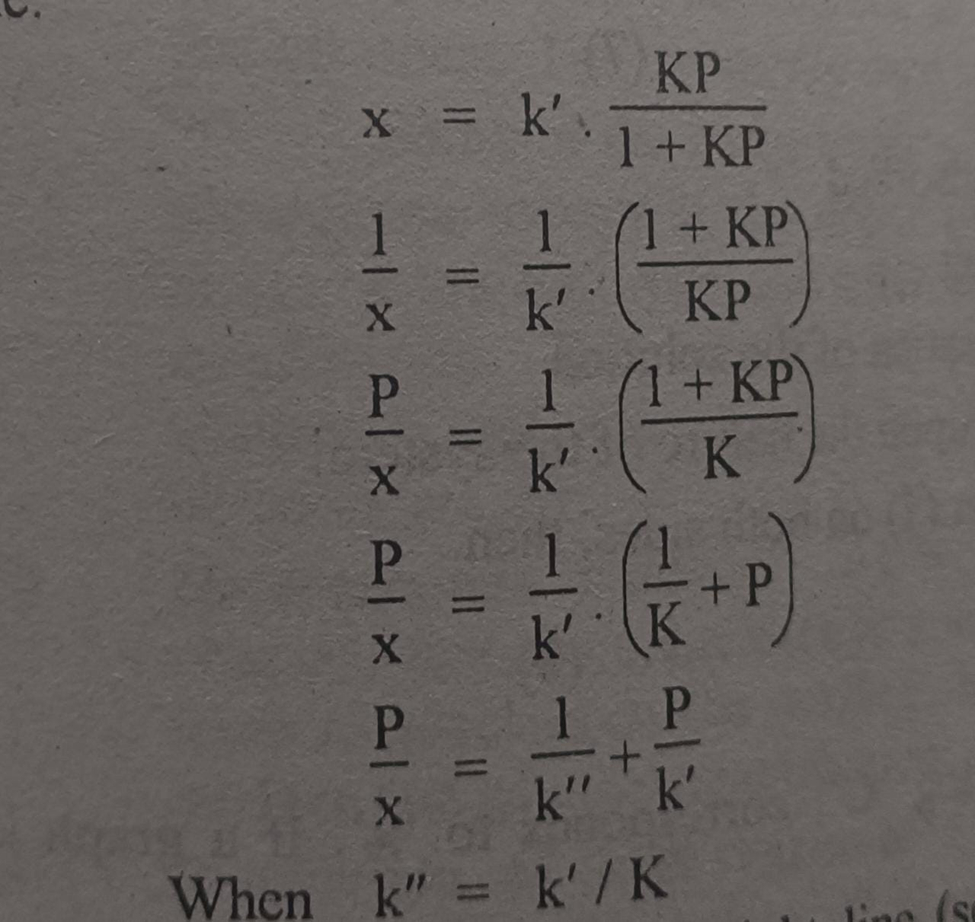
Equation in above image is of straight line. When a graph is plotted between P/x on y-axis and pressure of the system an x-axis then a straight line is obtained.
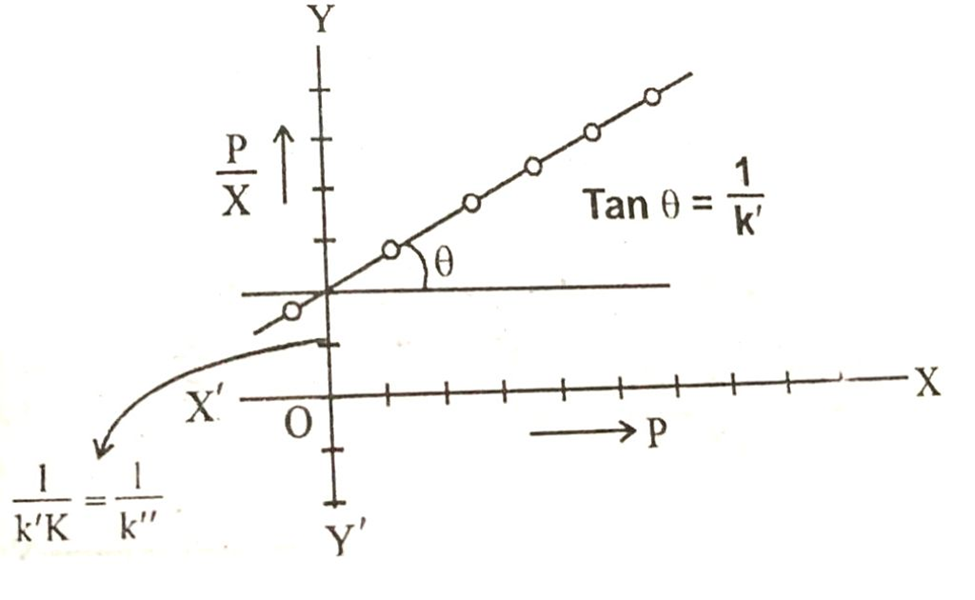
From the slope of the straight line we can get the value of 1/k and intercept of the straight line gives the value of 1/k.
Langmuir adsorption isotherm also holds at low pressure but fails at high pressure.