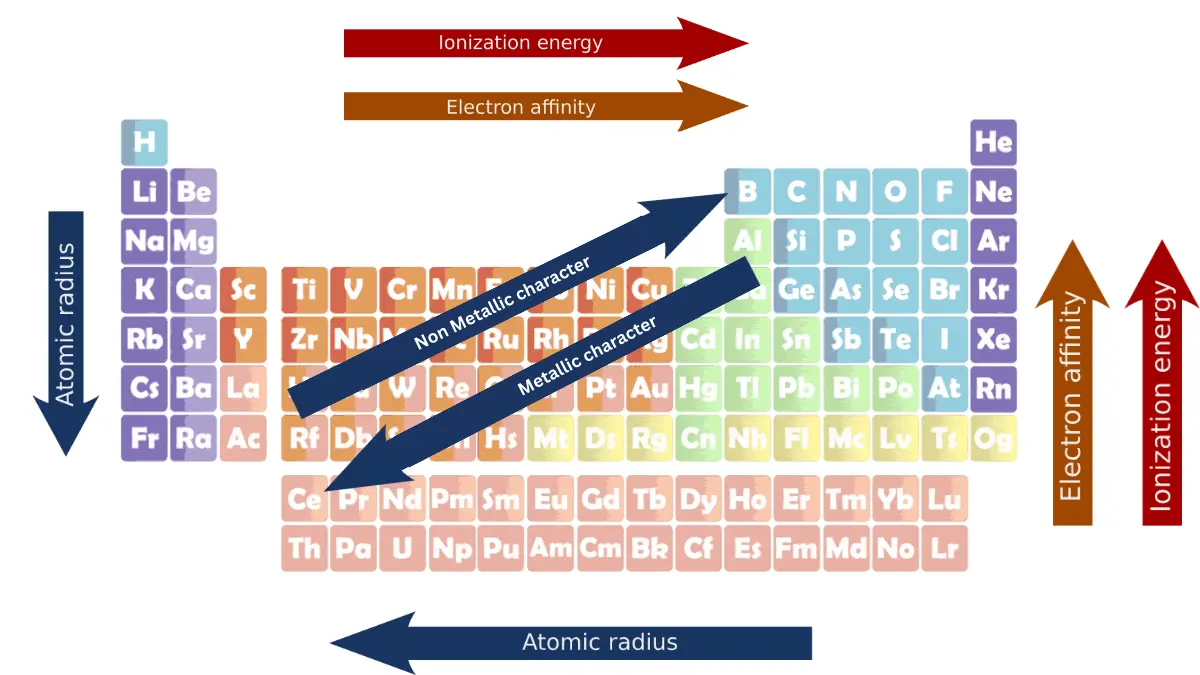
Periodic trends are the patterns in the properties of elements that can be observed when the elements are arranged in order of increasing atomic number. This arrangement is known as the periodic table. Some of the most important periodic trends include ionization energy, atomic radius, electron affinity, and metallic character.
In Modern Periodic Table, the elements are arranged in the ascending order of their atomic number. Elements are placed in groups and periods based on similar properties and systematic variation of properties.

1: Atomic radius trends
Table of Contents
The average distance between the nucleus of the atom and its outermost shell provided that the atom is assumed to be spherical is called the atomic radius.
Across a period
Atomic radius decreases from left to right. This is because the effective nuclear charge increases across a period, as the number of protons in the nucleus increases without an increase in the number of electron shells.
This increased nuclear charge pulls the outer shell electrons closer to the nucleus, making the atom smaller.
Down a group
Atomic radius increases from top to bottom. This is because the number of electron shells increases down a group, which increases the distance between the nucleus and the outermost shell of electrons.
The shielding effect also increases down a group, which makes the outer shell electrons less attracted to the nucleus, and makes the atom larger.
2: Atomic radius trends in transition elements
Atomic radius trends in transition elements are more complex than in main group elements. This is because the d electrons in transition elements can shield the outer shell electrons from the nucleus.
The shielding effect of the d electrons generally increases across a transition element series, which makes the outer shell electrons less attracted to the nucleus, and makes the atom larger. However, there are some exceptions to this trend.
3: Ionic radius trends in periodic table
The distance from the center of charged atom to the periphery of the active sphere is called ionic radius.
Definition of Ionic radius
Ionic radius trends in periods
Here is Ionic radius trends in periods:
Cations
As we move from left to right in a period, the ionic radii of cations decrease. This is because the effective nuclear charge increases across a period, as the number of protons in the nucleus increases without an increase in the number of electron shells.
This increased nuclear charge pulls the outer shell electrons closer to the nucleus, making the cation smaller.
Anions
As we move from left to right in a period, the ionic radii of anions increase. This is because anions have gained electrons, which increases the number of electron shells and the distance between the nucleus and the outermost shell of electrons.
Ionic radius trends in groups
Here is Ionic radius trends in groups:
Cations
As we move from top to bottom in a group, the ionic radii of cations increase. This is because the number of electron shells increases down a group, which increases the distance between the nucleus and the outermost shell of electrons.
Anions
As we move from top to bottom in a group, the ionic radii of anions increase. This is because anions have gained electrons, which increases the number of electron shells and the distance between the nucleus and the outermost shell of electrons.
4: Ionization energy trends in the periodic table
Ionization energy is the minimum amount of energy required to remove the most loosely bound electron from an isolated atom or ion in the gaseous state.
Across a period
Ionization energy increases from left to right. This is because the effective nuclear charge increases across a period, as the number of protons in the nucleus increases without an increase in the number of electron shells.
This increased nuclear charge attracts the outer shell electrons more strongly, making it more difficult to remove them, and increasing the ionization energy.
Down a group
Ionization energy decreases from top to bottom. This is because the number of electron shells increases down a group, which increases the distance between the nucleus and the outermost shell of electrons.
The shielding effect also increases down a group, which makes the outer shell electrons less attracted to the nucleus. Both of these factors make it easier to remove the outermost electron, and decrease the ionization energy.
Exceptions to the trends
There are a few exceptions to the ionization energy trends in the periodic table. For example, the ionization energy of aluminum is higher than the ionization energy of magnesium, even though aluminum is to the right of magnesium on the periodic table.
This is because aluminum has a stable half-filled p orbital configuration, which makes it more difficult to remove an electron.
Ionization energies of noble gases
Ionization energy values of noble gases have the maximum values in respect to periods because their outermost shells are completely filled.
5: Electron affinity trend in periodic table
The minimum amount of energy that is released the observed when an electron is added to an isolated neutral gaseous atom in its lowest energy state. It produces an anion is called electron affinity.
Definition of electron affinity
Across a period
Electron affinity increases from left to right. This is because the effective nuclear charge increases across a period, as the number of protons in the nucleus increases without an increase in the number of electron shells.
This increased nuclear charge attracts the electron that is being added more strongly, which releases more energy, and increases the electron affinity.
Down a group
Electron affinity decreases from top to bottom. This is because the number of electron shells increases down a group, which increases the distance between the nucleus and the outermost shell of electrons.
The shielding effect also increases down a group, which makes the outer shell electrons less attracted to the nucleus. Both of these factors make it less difficult to add an electron, and decrease the electron affinity.
Exceptions to the trends
There are a few exceptions to the electron affinity trends in the periodic table. For example, the electron affinity of oxygen is higher than the electron affinity of fluorine, even though oxygen is to the left of fluorine on the periodic table. This is because oxygen has a half-filled p orbital configuration, which is very stable.
Why alkali metals have the lowest electron affinity
Alkali metals have the lowest electron affinity because they have a strong tendency to lose electrons to achieve a stable noble gas configuration. Adding an electron to an alkali metal atom would make it negatively charged, which is not stable.
Why halogens have the highest electron affinity
Halogens have the highest electron affinity because they have a strong tendency to gain electrons to achieve a stable noble gas configuration. Adding an electron to a halogen atom would give it a full outer shell, which is very stable.
6: Metallic character trend in periodic table
Metallic character is the tendency of an element to exhibit the properties of metals, such as electrical conductivity, thermal conductivity, and malleability.
Metallic character increases from top to bottom in a group and decreases from left to right in a period. This is because the effective nuclear charge increases across a period, which makes it more difficult for the outer shell electrons to be lost and form metallic bonds.
The nuclear charge also increases down a group, but the shielding effect of the inner shell electrons also increases, which makes it easier for the outer shell electrons to be lost and form metallic bonds.
7: Non-metallic character trend in periodic table
Non-metallic character is the tendency of an element to exhibit the properties of non-metals, such as low electrical conductivity, brittleness, and the ability to form covalent bonds.
Non-metallic character decreases down a group and increases from left to right in a period. This is because the same factors that influence metallic character also influence non-metallic character.
8: Metalloids trend in periodic table
Metalloids are elements that have intermediate properties between metals and non-metals. They are located along the diagonal line that runs from boron to polonium on the periodic table. Metalloids have a variety of uses, including in semiconductors, solar cells, and batteries.
9: Melting and boiling point trends in periodic table
Melting point is the temperature at which a solid melts into a liquid. Boiling point is the temperature at which a liquid boils into a gas. The melting and boiling points of elements are influenced by the strength of the forces between the atoms.
Melting and boiling points generally increase across a period and decrease down a group. This is because the strength of the forces between the atoms increases across a period and decreases down a group. The stronger the forces between the atoms, the more energy is needed to break them and melt or boil the substance.
There are some exceptions to these trends. For example, the melting point of gallium is lower than the melting point of aluminum, even though gallium is to the right of aluminum on the periodic table. This is because gallium has a unique crystal structure that makes it easier to melt.
Let others know about this